TOP > 研究会情報 > 2023年3月2日(木)の再エネ講座セミナー 議事録
2023年3月2日(木)の再エネ講座セミナー 議事録
2023年3月2日
Policy design for diffusing hydrogen economy and its impact on Japanese economy by 2050 carbon neutrality using E3ME-FTT model
The contents are Introduction, Methodology, Representation of the hydrogen economy, Scenario design, Simulation results, Conclusion & discussion, Limitations & Challenges.
background
The background of this study is that Japan has announced to achieve Net-Zero by 2050, the Ministry of Economy, Trade, and Industry (METI) launched a Roadmap to “Beyond-Zero” Carbon (scale up hydrogen supply, make hydrogen affordable, decarbonise downstream sectors such as power generation and hydrogen supply, exploit CCUS )and Soocheol et al. published a Net-Zero scenario but that excluded the scope of the hydrogen economy at last year.
Introduction of E3ME and FTT
E3ME follows the post-Keynesian school of thought and Demand-driven and is macroeconometric model. Economies do not per se operate in equilibrium in E3ME. FTT is technoeconomic diffusion model which builds on evolutionary economics and heterogeneous agents. FTT does not per se follow a least-cost approach.
E3ME’s central (technology) is represented by FTT at key sectors. Climate, Economy, emission, energy are represented by E3ME. They and technology effect with each other.
Introduction of E3ME-FTT
It is a flow of information going to technology diffusion (FTT:Power, FTT:Transport… ) and represent on E3ME. We setup prices to feed in FTT:Steel model and get policy assumptions in (FTT:Power, FTT:Transport, FTT:Heating, FTT:Steel) to feed back E3ME (e.g. electricity price and supply).
Introduction to E3ME-FTT:Steel
The representation of agents is important in this model. Different agents have different perceptions and hold different valuations of the future. Entrepreneurs are risk-seeking agents and expect higher rates of returns (but that is not guaranteed). Without risk-seeking agents, new technologies will never see the light of day. The technology was very expensive before. Because some agents took risk, costs of new technology were lower. Almost all companies are using these technologies now.
Theoretical framework of FTT
Uncertainty is key in FTT and there are many sources of uncertainty. The heterogeneity of agents is just one of them. Technologies compete with each other for market shares on the basis of expected costs differentials, which can be influenced by policies. FTT uses a replicator function to determine market share changes based on the Lotka-Volterra (LV) equation (or predator-prey). The LV equation contains parameters for “births” and deaths”, like in demographic and ecological modelling. For a full description of the theoretical and mathematical framework I refer to:
1.Mercure, J. F. (2012). “FTT: Power: A global model of the power sector with induced technological change and natural resource depletion”. Energy Policy, 48, 799-811.
2.Mercure, J. F. (2015). “An age structured demographic theory of technological change”. Journal of Evolutionary Economics, 25(4), 787-820.
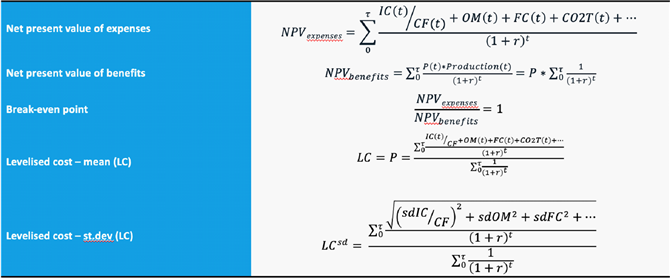
Formula
Levelised cost
Each FTT models use Levelised cost to compare technologies.
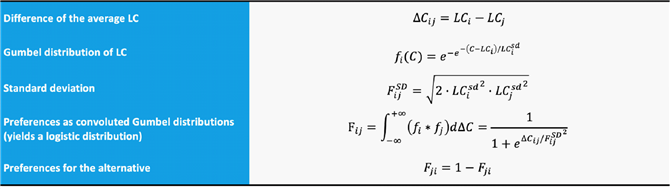
Investor preferences
i, j are two technologies.
Figure
Investor preferences Fji=1-Fji
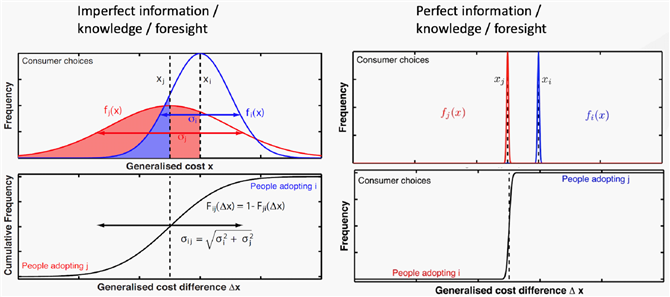
The figure shows that Fji and Fji sum to 1. The left is Imperfect information / knowledge / foresight. In the left side, technology i’s diffusion is fi(x) and technology j’s diffusion is fj(x).
The right is Perfect information / knowledge / foresight. It is the case we deal with. i and j depending on cost deference which is very small to get 1% of the choice.
Market share dynamics
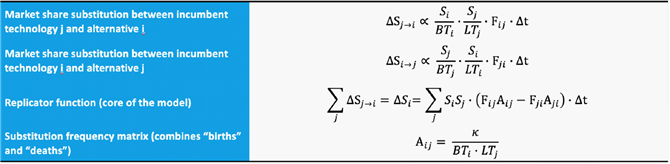
△S Total market change, △Sj→i is market change from j to i.
Market share dynamics
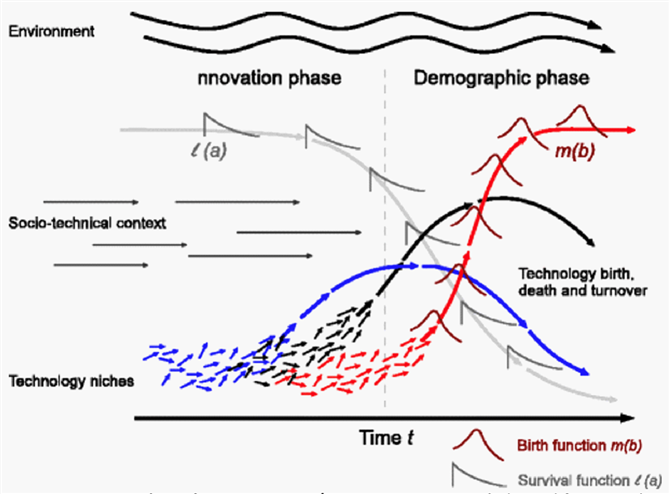
Technology diffusion takes place in a certain context which change from time. Technology diffusion may change the context. They affect each other. There are Soclo-technical context too. The diffusion happen to new technologies, then we switch to new technologies (red line). Some intervention are successful, most of them are not (blue line and black line).
Learning-by-doing
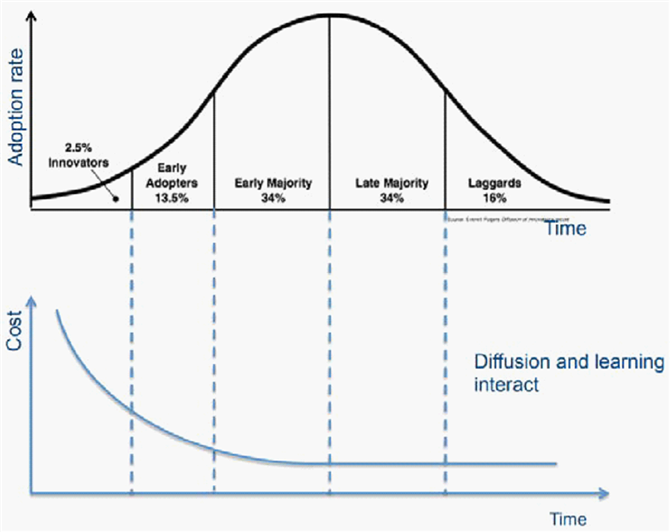
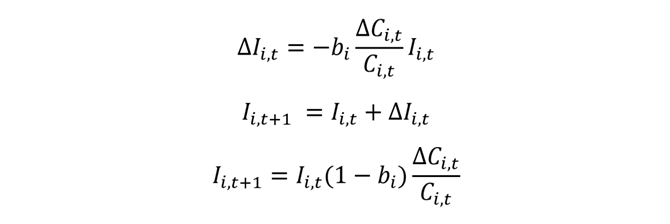
As a technology diffuses into a system its costs go down due to learning-by-doing effects. For every technology i at time t, the investment costs I go down at a rate b, for every doubling of global cumulative capacity C.
Calibration
The method outlined here requires a lot of data and a lack of data can lead to strange behaviour because FTT is path dependent model. However, bad or missing data is unavoidable and to remedy that calibration is needed. That is why we use Calibration.
Calibration occurs by adding values to the levelised cost estimates

The calibrated levelised cost feed into the preference matrix which changes the decisionmaking core. We calibrate “by eye” and calibration is assumed to be finished when the market share increments of the last few historical years are aligned to the market share increments of the first few simulated years
Technological representation in FTT
FTT:Power
24 Technologies
We input Electricity demand from E3ME and get output of Fuel demand and emissions, Electricity price, Electricity investment, Detailed PG employment to E3ME
FTT:Transport
25 Technologies
We input Fleet/ car demand from E3ME and get output of Fuel demand and emissions, Average car price to E3ME
FTT:Heating
13 Technologies
We input Heat demand from E3ME and get output of Fuel demand and emissions, Costs of boilers to E3ME
FTT:Steel
26 Technologies
We input Steel demand from E3ME and get output of Fuel demand and emissions, Steel investment, Steel price and Detailed steel employment to E3ME
H2 supply
Exogenous representation of Hydrogen supply (includes exogenous hydrogen prices)
We intend to make FTT: H2 which we did not manage to do.
We got policies to apply. Some are Tax (carbon, fuel, vehicle, boiler), Subsidy, Regulations (phase out, limits), Turnover time, Discount rate, Feeds in tariff, Demonstration technology and Demand side policies (e.g. building energy efficiency).
Representation of hydrogen supply
Hydrogen demand is simulated by E3ME-FTT. There is no representation in the residential heating sector. Non-FTT sectors use relevant FTT sectors as proxy for hydrogen demand. However, E3ME-FTT does not explicitly represent the hydrogen supply sector. Therefore, we resort to an exogenous representation of hydrogen supply.
The hydrogen price from 20,000 yen Nm3 to 20 yen Nm3 in 2050. The hydrogen supply from 2000 to 100,000 (1000t/y) in 2050.
METI provides:
– Domestic hydrogen supply targets
– Domestic hydrogen price targets
– If demand exceeds supply projection, we assume hydrogen imports at 150% of the price
Exogenous development of technologies of hydrogen is shoes in below
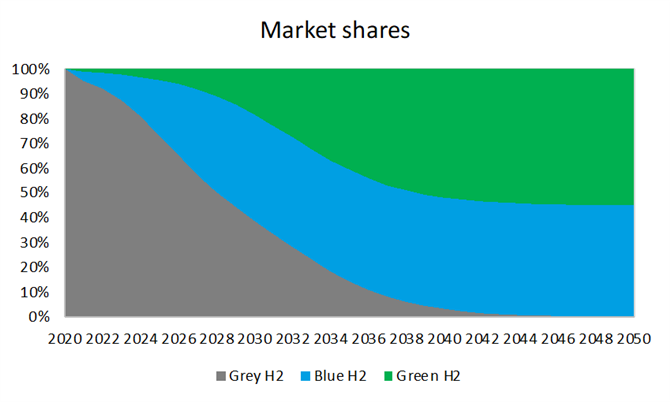
Start with grey hydrogen and get first replaced by blue hydrogen (CCS to capture the carbon emissions), and then slowly replaced by green hydrogen. In 2050, we will have 50% of blue hydrogen and 50% of green hydrogen.
Disentangling hydrogen markets
Captive, on-site market vs merchant markets
– Captive: hydrogen production occurs at the site of demand (e.g. oil refineries)
– Merchant: dedicated to supply niche markets (e.g. research institutions)
– Merchant market << captive market
– Statistics are scarce for the captive market due to the lack of transactions
– Source: Pacific Northwest National Laboratory
Feedstock market vs energy market
– Most of the current hydrogen use is feedstock (oil refineries, chemical industry)
– Virtually no energy market as of yet
In this study, we only consider hydrogen energy markets
Scenario Design
Reference scenario
We calibrated GDP, Population, Employment, Energy use and Emissions from IEEJ2021.
Fixed power generation configuration.
Continued diffusion in private road transport, freight road transport, and iron & steel industry
Net-Zero policy scenario
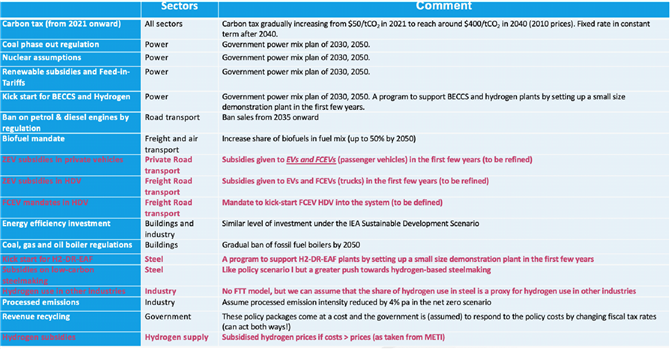
Carbon tax gradually increasing from $50/tCO2 in 2021 to reach around $400/tCO2 in 2040 (2010 prices). Fixed rate in constant term after that.
In power sector, we followed Government power mix plan of 2030, 2050. We will phase-out and see renewables, bio energies, CCS and hydrogen.
We ban sales in road transport and increase share of biofuels in fuel mix in freight and air transport.
The high lighted are different with previous study.
We apply fuel sales in FTT model. That means we set a sale’s target that mandate by government.
Buildings and industry along with the IEA Sustainable Development Scenario. And Gradual ban of fossil fuel boilers by 2050 in Buildings sector.
In steel sector, we also supply hydrogen. And hydrogen use in other industries grow with hydrogen steel.
There are hydrogen subsidies on hydrogen supply. They update green hydrogen supply.
Sector specific policies relating to hydrogen
In FTT:Steel, there are Carbon tax, Phase-out of carbon intensive processes, Initial kick-start program of hydrogen-based steelmaking and Subsidies on low-carbon steelmaking.
FTT:Power Follows the Government Power Mix Plan (GPMP) and includes Carbon tax, Subsidies, Feed-in-Tariffs.
FTT:Tr includes Ban on sale of ICE vehicles, Road tax on ICE vehicles, Fuel tax on petrol and diesel, Biofuel blending mandate, Government mandate on FCEVs (kick-start) and Support of FCEVs.
Simulation results
Technology diffusion
In technology of power generation, the fossil is replaced by solar PV and fossile+CCS.
In steelmaking, the EF-BOF almost phase-out and replaced by either SR-BOF based making or hydrogen based making or recycling.
In residential heating, we do not have hydrogen.
In private vehicles, we see hybrid vehicles decrease and EVs, HEVs grow.
In Freight trucks, because we force the mandate, there are a large FCEV trucks.
The hydrogen supply is all grey hydrogen in Reference scenario. But we force green and blue hydrogen in Net-Zero policy scenario.
Energy demand
We see hydrogen demand in power generation and steelmaking
Hydrogen steelmaking still need a lot of electricity.
In private vehicles, the amount transit to EV and fuels vehicle, because the electricity powertrain is more efficient than other power-train.
The total freight trucks declines because of the gain of hydrogen and biofuel.
There is no any hydrogen supply in reference, but in Net-Zero scenario, we can see so many electricity and gas because of hydrogen supply.
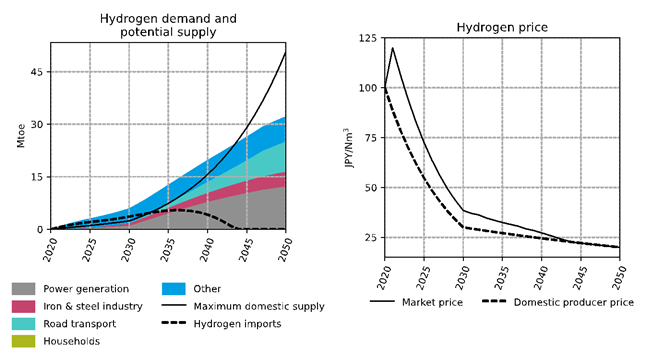
Hydrogen demand
In hydrogen demand and potential supply graph, the black solid line is maximum domestic hydrogen supply. Up to 2044, the hydrogen demand abases supply. The dash line mean that hydrogen must be imported. After that, the supply is enough for demand. And hydrogen supply is for power generation, iron & steel industry, road transport, households and others.
In Hydrogen price graph, the dash line means domestic producer price. It is projection of METI. It is fit in the model of the solid line. The makes the interval happened.
Macro-economic impacts
We need to talk a little bit policy spending and revenues. We are looking at net cost.
In the first graph, the positive number is costs and negative number is revenues. The green range is the carbon tax revenues, and the blue range is the policy costs. Up to 2033, we have net income. After that, it is not. It represents by black line and related to ‘fiscal response relative to REF’. In 2050, the is 200 something increased than reference. It means additional 20%
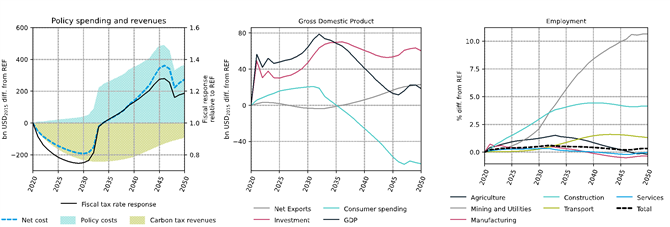
In the middle of the graph, the black is GDP, red line is investment, the net exports is grey line and consumer spending is blue line. At first, GDP is dominated by investment of new technology which need to additional economic invest in old sectors. The decreases in consumer spending come from the decreasing income. By the end of 50th, we see a positive in net export. Recently Japan rely on energy import, but in the end of 50th, there will be less in hydrogen economy.
In Employment, the dash line means total. Each line means different sectors. There is increase in construction sector because the demand of new power plans and new steel making plans. The increase also come from the force of hydrogen supply
Main finding
Deep decarbonisation via promotion of a hydrogen economy is possible!
By 2050, 12% of all energy input to the Japanese economy is hydrogen, while 34% is electricity demand (of which a large portion is needed for hydrogen production)
Promoting the hydrogen economy leads to positive GDP impacts, which are driven by investment boosts in new low-carbon technologies, while consumer expenditure takes a hit
The costs of the subsidies are the main driver for negative consumer expenditure outcomes
Limitations of E3ME
The Net-Zero scenarios indicate systematic (sudden) change rather than marginal change; econometrics cannot deal with systematic change in terms of technology. Hence, why FTT is used instead.
E3ME is agnostic on the source and availability of investment. Money is endogenous in PostKeynesian economics and it can be created through lending; In E3ME it is implicit. There is no full crowding out. The model shows the investments required to achieve this representation of Net-Zero. It does not say anything on the availability of the funds.
Any data intensive model will run into data quality and availability issues. E3ME covers more than 60.000 estimate parameters
Value chain of hydrogen supply not properly represented in the model due to lack of existing sources
Employment effects in the hydrogen supply sector highly uncertain
Limitations of FTT
Only an exogenous representation of hydrogen supply
Technology representation is always partial
Breakthroughs inherently difficult to simulate
– Innovator effect versus imitator effect
In FTT, infrastructure and technologies are assumed to co-evolve
– E.g. charging points for EVs, hydrogen fuelling stations
Rate of electrolyser capacity expansion is uncertain
– Odenweller et al. (2022) question the rate of scalability of electrolyser capacity needed to achieve green hydrogen targets
Effectiveness of CC(U)S/BECCS is questionable
Q&A
1.Prof. Nagata:
1) About the methodology.
In previous model of 2021, you use continuity technology. Why you jump up (adopt to) the discontinued innervation technology, particularly for hydrogen?
2) Hydrogen is not ideal energy. For example, many institutions in Japan thinking about import green hydrogen from Australia around 10% of total energy. But liquid hydrogen need 5 times for shipping cost. Because the temperature is -253 for hydrogen and much lower than natural gas. That is why hydrogen is not sufficient for Japanese economy. How do you estimate hydrogen compare with natural gas.
There are other options. Off shore, onshore, nuclear power… Nuclear is supported from Government. Why using Hydrogen?
Answer:
1) I am not quite sure what is methodology. The previous study is looking at the hydrogen economy in relationship to Net-Zero target. The previous study is showing mainly electrification, but now we want to look at hydrogen economy because it mention quite often in Japanese setting. That is a big focus on getting fuel on the world. That is why we provide hydrogen-based technologies.
2) We do apply the positive feedback to the NOFT sector. It also include hydrogen demand. Only the supply side is completely exogenous. Once a decision has to be made, at first can be expensive for sure but at some point, you will see lower cost. Of course comparing with solar PV, fuel generation is way behind. For hydrogen supply, we do not in the moment, because we do not have a modeling representation on that.
Point one is why we focus on hydrogen, there are many options. But you mentioned nuclear, you know nuclear has many limitation. Renewable is very important. We could focus on other renewable e.g. offshore, onshore, but why we focus on hydrogen because it has possibility e.g. power, steel. It has various demand.
One more point is for 2050, I think more than 50% must come from renewable. Hydrogen can play a role in part of renewable energy. The possibility of hydrogen is one of the good option not only in Japan but also in other countries (Korea..). They think hydrogen is good option carbon neutrality.
2.Prof. Zhang:
I agree with Prof. Nagata. This model does not explain the evolution of hydrogen technology. For example, you take the data from METI for the hydrogen supply and cost price of the hydrogen. One suggestion is it is not fine because FTT is a technic evolution model.
For example, hydrogen you used at new technology not only in power but also steel, transportation. Therefore, for each the model of FTT model, for example, in transportation model, we could take Ht as demand for the hydrogen. Through this way, not only in transportation sector but also for example, in heating sector, we could use the normal technology such as hydrogen heating in Japan. And such heating technology could round year by year. Through this way, we could improve the hydrogen representation.
Answer:
I feel there are some confusion. We are modeling hydrogen demand of technologies in FTT sectors or most of the FTT sectors. Indeed it is not for the supply. It is a gap for this study.
Prof. Zhang:
Yes. I think this is the weakness for this model. There is a possibility to endogenously modeling the supply of the hydrogen technology. For example, in FTT transportation, if we do not treat the hydrogen as the fuel, but treat hydrogen as a technology, then we could endogenously model the hydrogen demand, supply and the cost of the hydrogen technology and evolution in FTT model. Maybe we could improve the FTT model.
Answer:
Yes, there are still some something we are trying to develop hydrogen supply model. The reason why we did not mention to do that it is the complication of the statistics, current valuable. Because it happens in all the sectors. And we have issue with getting hydrogen data set. Otherwise we will get hydrogen supply from FTT inside. But fuel vehicle and transport and are models as technology as separate technology from EVs and HEVs. It is very important to know we are missing interesting feedbacks between hydrogen supply and demand.
I think it is also the question of Prof. Nagata, if we simulate hydrogen supply endogenously, then we can investigate the feedback between endogenous prices and demand, through hydrogen demand technologies(FTT demand sectors). Then, that would be really interesting. That is something we will working there. Now that is really a big weakness of this study, but I think it is right to use METI projections. For my respect to the Japanese economy, I choose to believe METI rather than myself on this subject. But we will work with endogenous hydrogen supply model.
pdf資料(2.49MB)